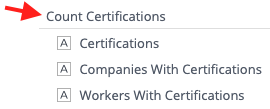
There are two types of Data Points in Analytics: "Details" and "Count." The Data Point Type can typically be found in the heading for the Data Point group. This article will explain the difference between these Data Points, and why you would select "Count" or "Details."
Count Example: 
Details Example:

Details Data Points
Definition: Details Data Points are most commonly used as a widget/dashboard filter, category, row, column, x-axis, y-axis, date, or break by. Details Data Tables usually contain human-readable information, ie, Worker Name contains all Worker names.
Common Use Cases: Widget/Dashboard filter, Category, Row, Column, X-Axis, Y-Axis, Date, or Break By
Example: Use "Location Name" to display the name of a Location Profile, rather than counting Locations.
Count Data Points
Definition: Count Data Points are most commonly used to determine a Value, by listing unique items. Count Data Tables contain GUIDs (Globally Unique Identifier) rather than details so that each item is unique and able to be counted. For example, Count Workers contains a unique GUID for each worker in the system, rather than the Worker's name (As worker names are not guaranteed to be Globally Unique)
Common Use Case: Typically used in the "Values" section to show Analytics what to count in a Widget.
Example: Use "Locations" to count the total number of Location Profiles, rather than displaying Location Names.
For some real-world examples of how these data points can be used, check out this video:
 Ryan Harvey
Updated:
Comments