 Support Team
Updated:
Support Team
Updated:
Breakout Charts can be used to get more information from your Indicator Widgets. Indicator Widgets look like the screenshot below and are typically used to track a simple count in Analytics.
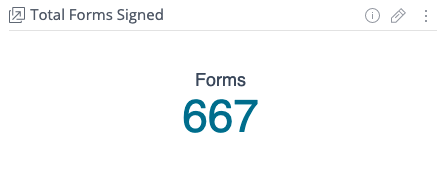
As you can see, there is not much detail in these Indicator Widgets. However, you can assign a separate dashboard to show details when you select an Indicator Widget. These are called Breakout Charts and you can set them up by following these steps.
Before you start, please ensure that the Indicator Widget and the Dashboard you plan to use for this process are both using the same Data Source. Your Data Source can be found at the top of each Dashboard.
![]() For more information about Data Sources and which one to use, click here!
For more information about Data Sources and which one to use, click here!
Once that has been checked, follow these steps:
1. Create a Folder named "Details," as this is where the Indicator Widget will pull from.
2. Drag the Dashboard you would like to use as a Breakout Chart into the "Details" folder.
3. Select the edit icon ( ) in the top-right corner of the Indicator Widget.
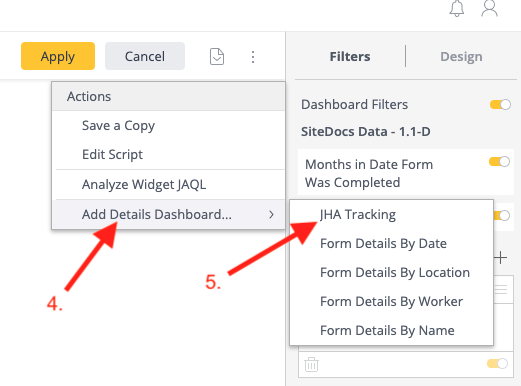
4. Once in the editing screen for the Indicator Widget, select the menu icon ( ) in the top-right corner of the screen and select "Add Details Dashboard" from the drop-down menu.
5. Select the Dashboard you'd like from the automatically-generated list to add it as your Breakout Chart.
6. Select the  button to save your changes.
Now, if you select the indicator number in the Indicator Widget, you will see the Breakout Chart in a pop-up window!
Comments