 Support Team
Updated:
Support Team
Updated:
The default colours of your Analytics Dashboards are controlled by the Colour Palette that you have selected. This can be changed by selecting the paintbrush icon in the top-right corner of your Dashboard and choosing one of the options in the dropdown menu.
The Colour Palette controls the baseline colours of your Dashboard, but you can change the colours of each of your widgets individually as well!
To set Single Colours:
To change the colour of a section of your Widget, simply select the coloured box for each section to view the available colours.
To set Conditional Colours:
Some Widgets have the option to place conditions on the colour scheme so that when a metric hits a specific goal, the colour will change.
If the widget supports Conditional Colours, you will see the option in the Colour window: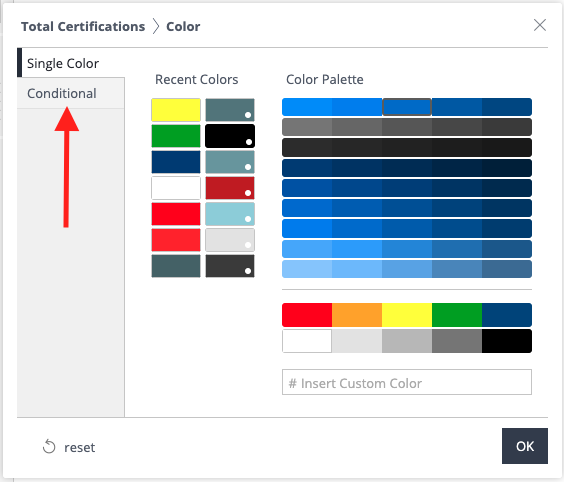
Note: If you don't see the Conditional option, it means that the values entered and/or widget type being used does not support Conditional Colours.
Once you've selected "Conditional," you will be able to set your conditions. Select the Condition icon to specify your goal, then select the colour you would like to display.
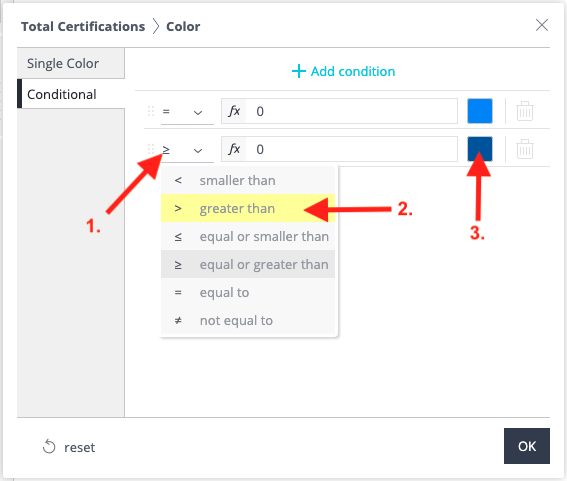
Don't forget to select the  button to save your changes.
Comments