
 Ryan Harvey
Updated:
Ryan Harvey
Updated:
This example uses Google Sheets:
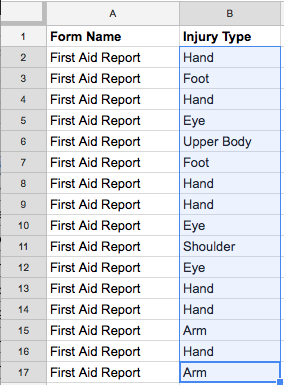
- You will need to build an Injury Report Form in your SiteDocs account that collects the necessary information. In this case, it would be necessary for the form to contain a question where the user indicates the Injury Type (by using a dropdown list, for example).
- Export form data from your Injury Report Form with a selected date range.
- Import your data into a spreadsheet program.
- Select the column which has your form item question on injury type and select all the answers.
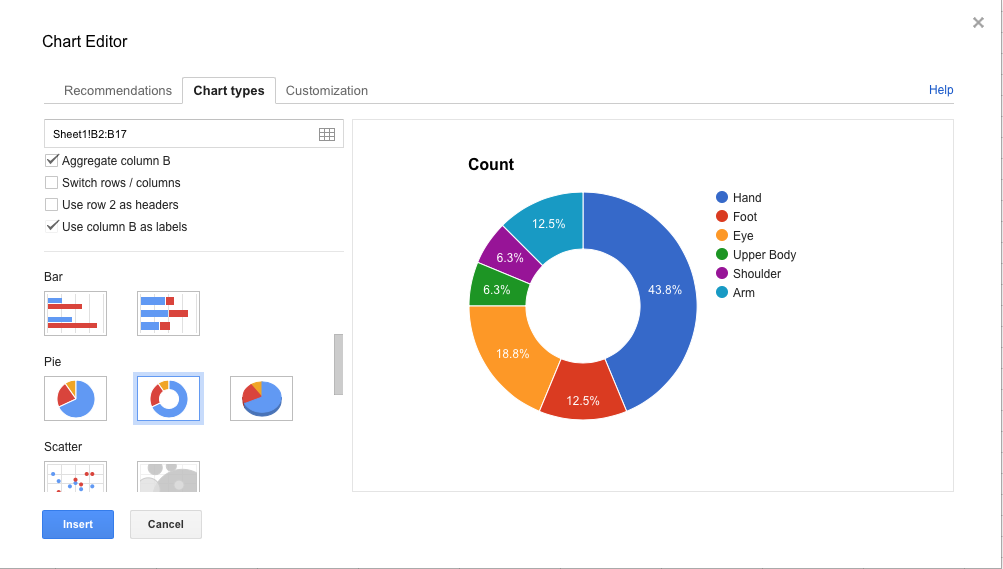
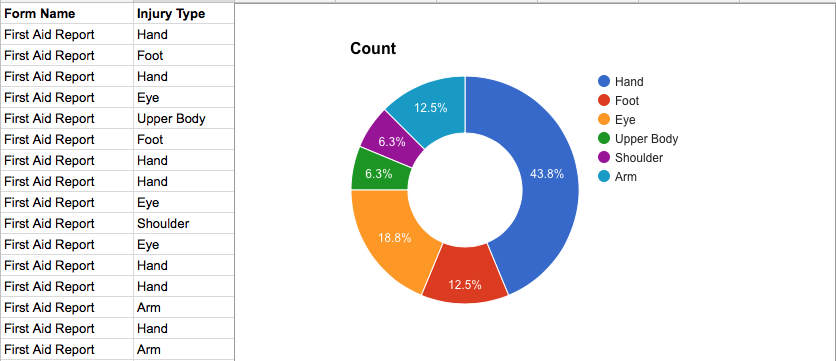
- Click 'Insert' and select 'Chart'.
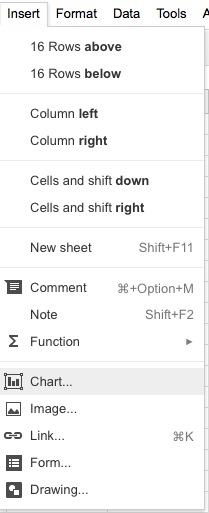
- Select 'Pie Chart'.
Too many steps? Check out our Analytics Product, which will do all of this for you! You can find more information about it HERE! To order Analytics or for pricing information, contact support@sitedocs.com.
Comments