
 Ryan Harvey
Updated:
Ryan Harvey
Updated:
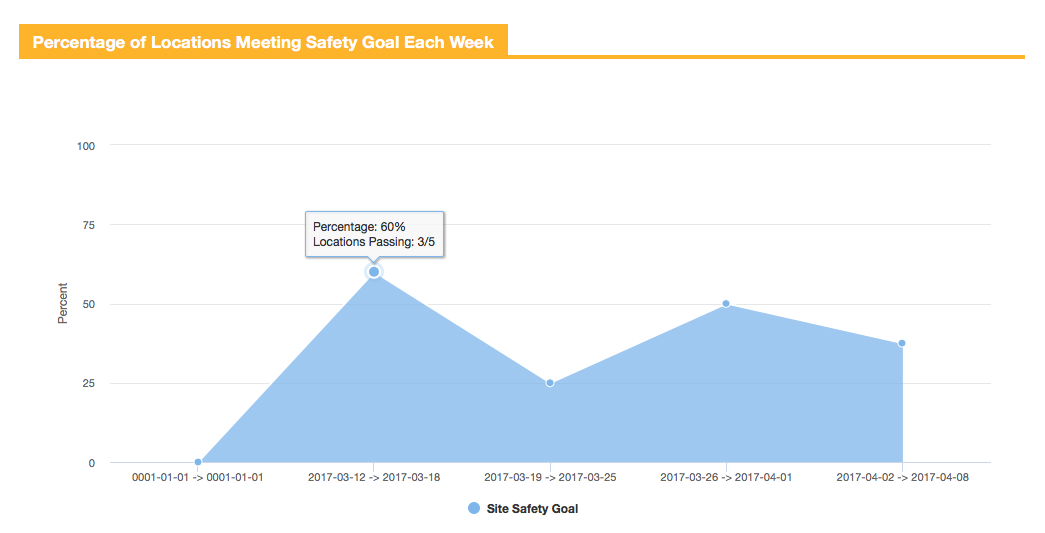
This report shows you a weekly trend of how many locations are meeting your Pass Percentage safety goal. For example, if you set your Pass Percentage goal at 85%, this report will tell you how many of your locations met this safety goal each week.
Note: You can adjust the date range of the report at the top of the page.
Useful Tip
You can hover over each data point to see how many locations met the safety goal that week.
Comments