
 Ryan Harvey
Updated:
Ryan Harvey
Updated:
This section allows you to see a breakdown of the Pass Percentage for each Location.
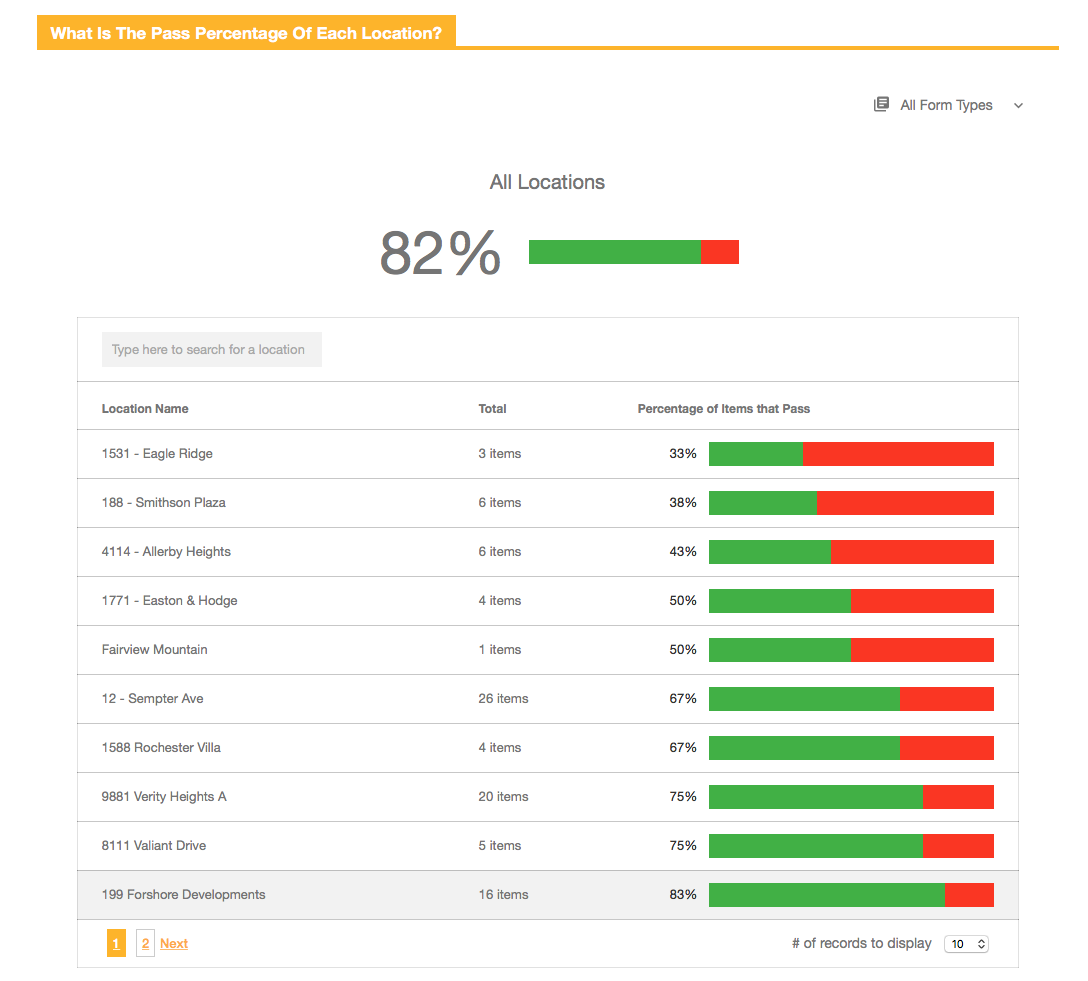
Overall Pass Percentage For All Locations In A Date Rage
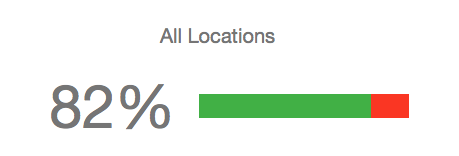
The top number in the chart represents the overall Pass Percentage for all Locations, in the given date range.
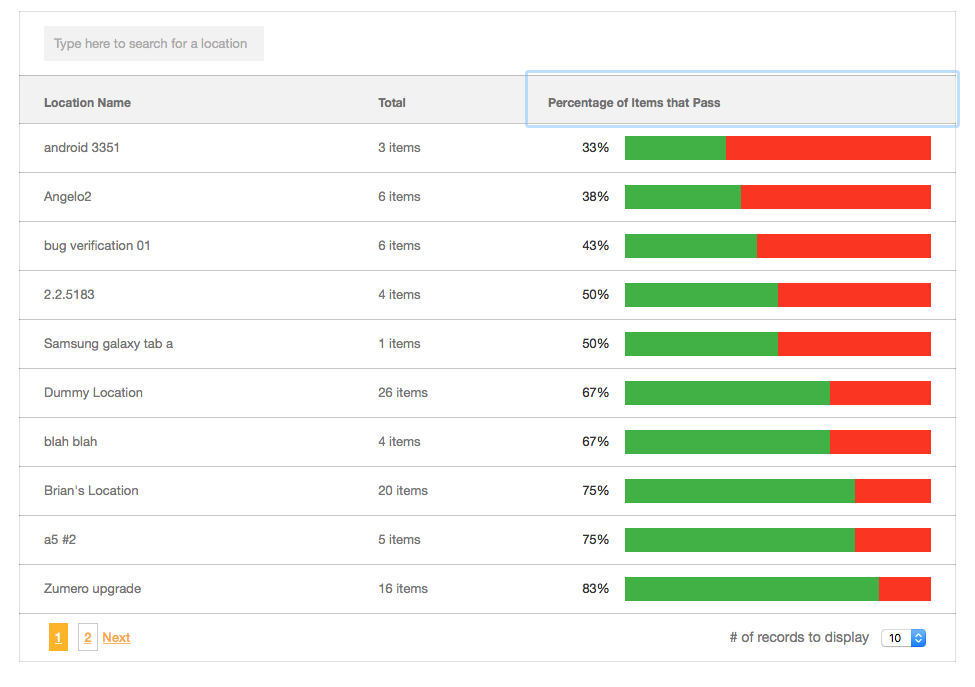
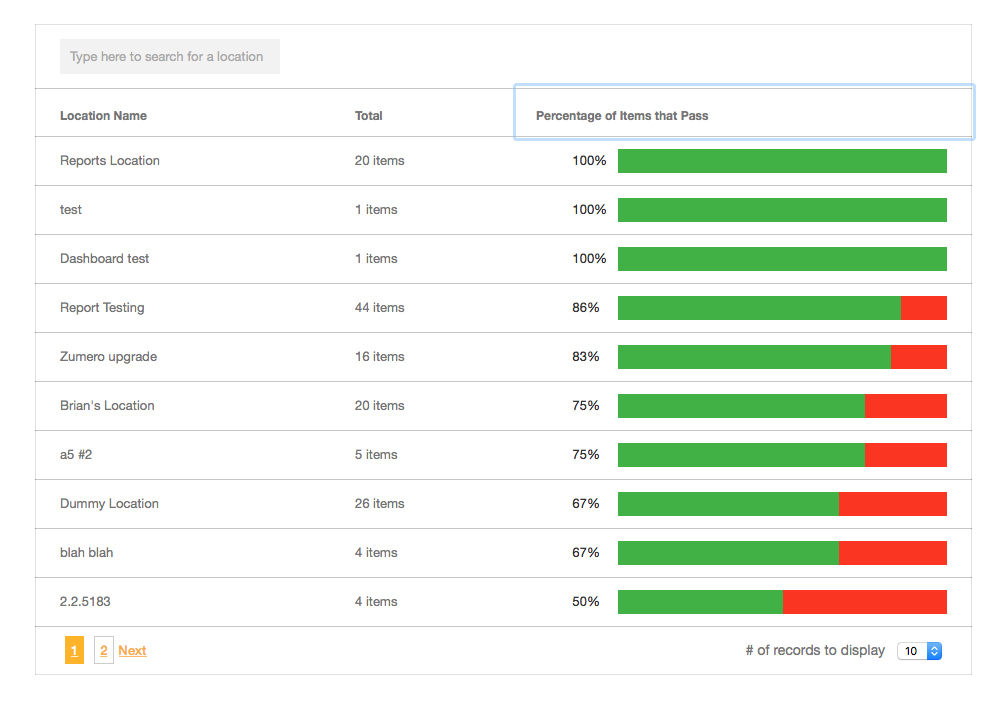
How Do I Change The Order of Locations?
Adjust how the chart is sorted by clicking any of the headings, such as Location Name, Total, and Percentage of Items that Pass.
Example:
In these two screenshots, you'll see that you can click on Pass Percentage header to sort by lowest number or highest number.
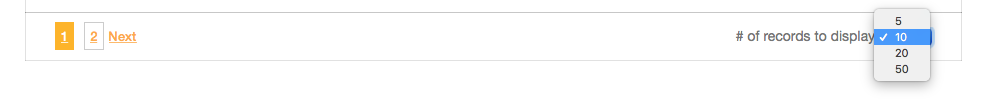
How Do I See More Locations At Once?
You can adjust how many Locations are viewed at once by clicking the dropdown menu at the bottom of the chart.
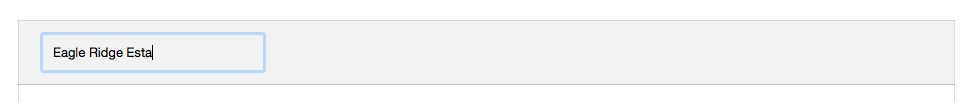
How Do I Find One Specific Location?
You can use the search bar to quickly find the Pass Percentage of a specific Location.
Note: Also, at the top of the entire Location Report, select a Location that will automatically filter the data to only show that specific Location.
Comments